R-squared does not necessarily measure goodness of fit. It can be arbitrarily low when the model is completely correct. By making \(σ^2\) large, we drive R-squared towards 0, even when every assumption of the simple linear regression model is correct in every particular.
What is \(σ^2\)? When we perform linear regression, we assume our model almost predicts our dependent variable. The difference between “almost” and “exact” is assumed to be a draw from a Normal distribution with mean 0 and some variance, which we call \(σ^2\).
This can create a particular problem among data analytics. Models can be interpretted as being incorrect based off of a poor \(R^2\) statistic, when in reality, the model fits in every regard.
This statement is easy enough to demonstrate. The way we do it here is to create a function that (1) generates data meeting the assumptions of simple linear regression (independent observations, normally distributed errors with constant variance), (2) fits a simple linear model to the data, and (3) reports the R-squared. Notice the only parameter for sake of simplicity is sigma. We then “apply” this function to a series of increasing variance values and plot the results.
r2.0 <- function(sig){
  # our predictor
  x <- seq(1,10,length.out = 100)
  # our response; a function of x plus some random noise
  y <- 2 + 1.2*x + rnorm(100,0,sd = sig)
  # print the R-squared value
  summary(lm(y ~ x))$r.squared
}
sigmas <- seq(0.5,20,length.out = 20)
 # apply our function to a series of sigma values
rout <- sapply(sigmas, r2.0)
plot(rout ~ sigmas, type="b")
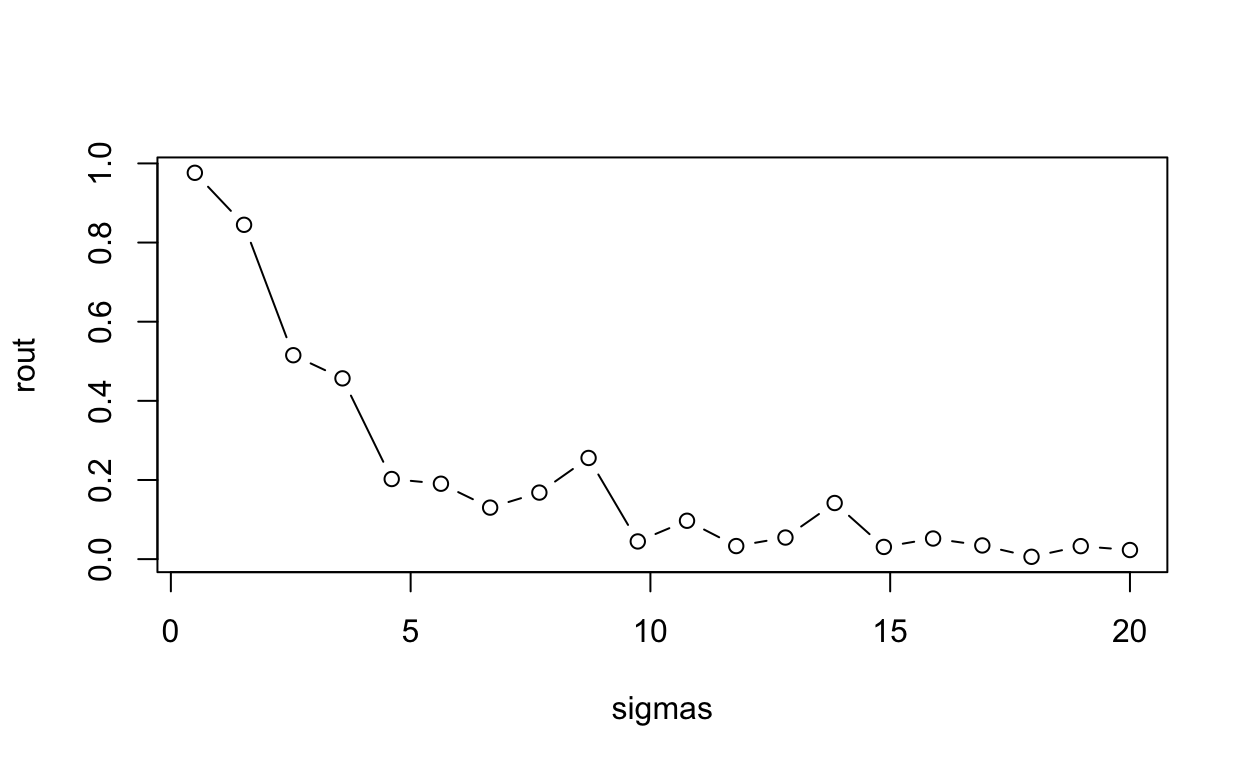
R-squared tanks hard with increasing sigma, even though the model is completely correct in every respect. There are a few other measures that can be used instead of \(R^2\) to measure the goodness of fit. The Root Mean Squared Error (RMSE), for example, can be used in its place. Or Specificity, Precision, Accuracy, or Recall.